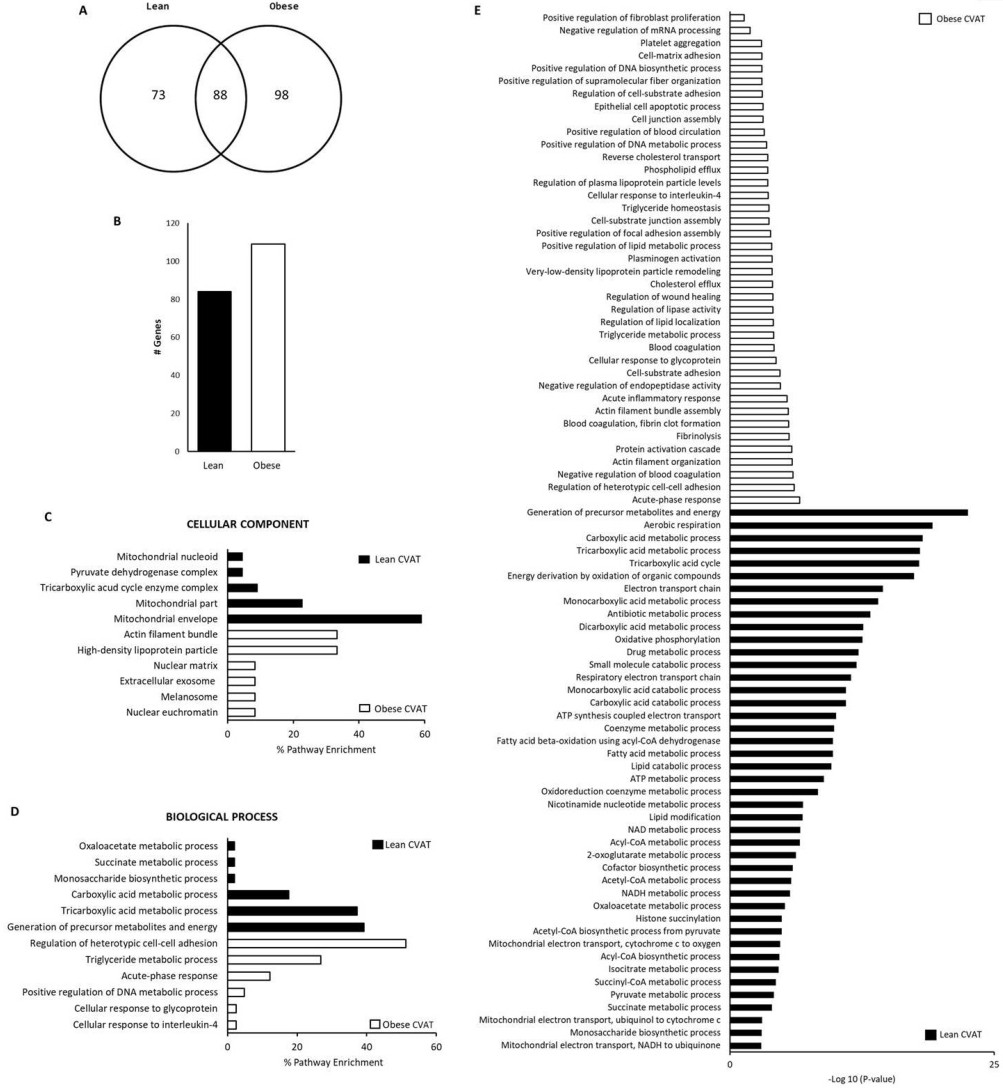
Fig. 3. Proteomics identification of protein and pathways. A - Venn diagram depicting the number of unique and overlapping genes between the two groups. B - Bar graph representation considering unique and most significantly different proteins in Lean and Obese CVAT. C - ClueGo and CluePedia analysis of cellular components considering unique and the most significantly different proteins. D - ClueGo and CluePedia analysis of biological process considering unique and the most significantly different proteins. E - Enrichment analysis of biological process pathways among lean and obese CVAT. The horizontal axis presents the -log10 of P-value), whereas the vertical axis presents the pathway name. The larger value of the horizontal axis suggests a more significantly enriched pathway in lean and obese CVAT.